


QEEG Test for Differential Diagnosis of ADHD
Over the past two decades, neuroscientists have conducted an intense study of the brain's electrical functioning. With the dawning of the "Digital Age", the "art" of medical specialists who visually inspect EEG records has been enhanced by the "pattern recognition" capabilities of a computer technology called "QEEG" (quantitative electroencephalography).
Understanding The Process of QEEG
QEEG is the analysis of brain waves that helps in differentiating between normal brain vs ADHD brain. Brain wave analysis assesses mental functioning through the use of measurements of brain wave activity. Brain waves are the fluctuations, usually rhythmical, of electric impulses produced by large group of neurons firing in the brain. These electrical signals are the results of an elaborate electro-chemical chain of events. EEG, the recording of the electrical activity of the brain, is a standard medical diagnostic procedure used in hospitals everywhere.
Brain wave activity reflects one’s level of arousal and shows decidedly different patterns, depending on whether the individual being measured is awake, asleep, or engaged in a cognitive task. Scientific evidence, growing out of a great deal of research and clinical study, now documents that these brain signals are related not only to level of arousal, but also to many aspects of cognition (thinking) and affect (emotion).
Nerve Cell Anatomy
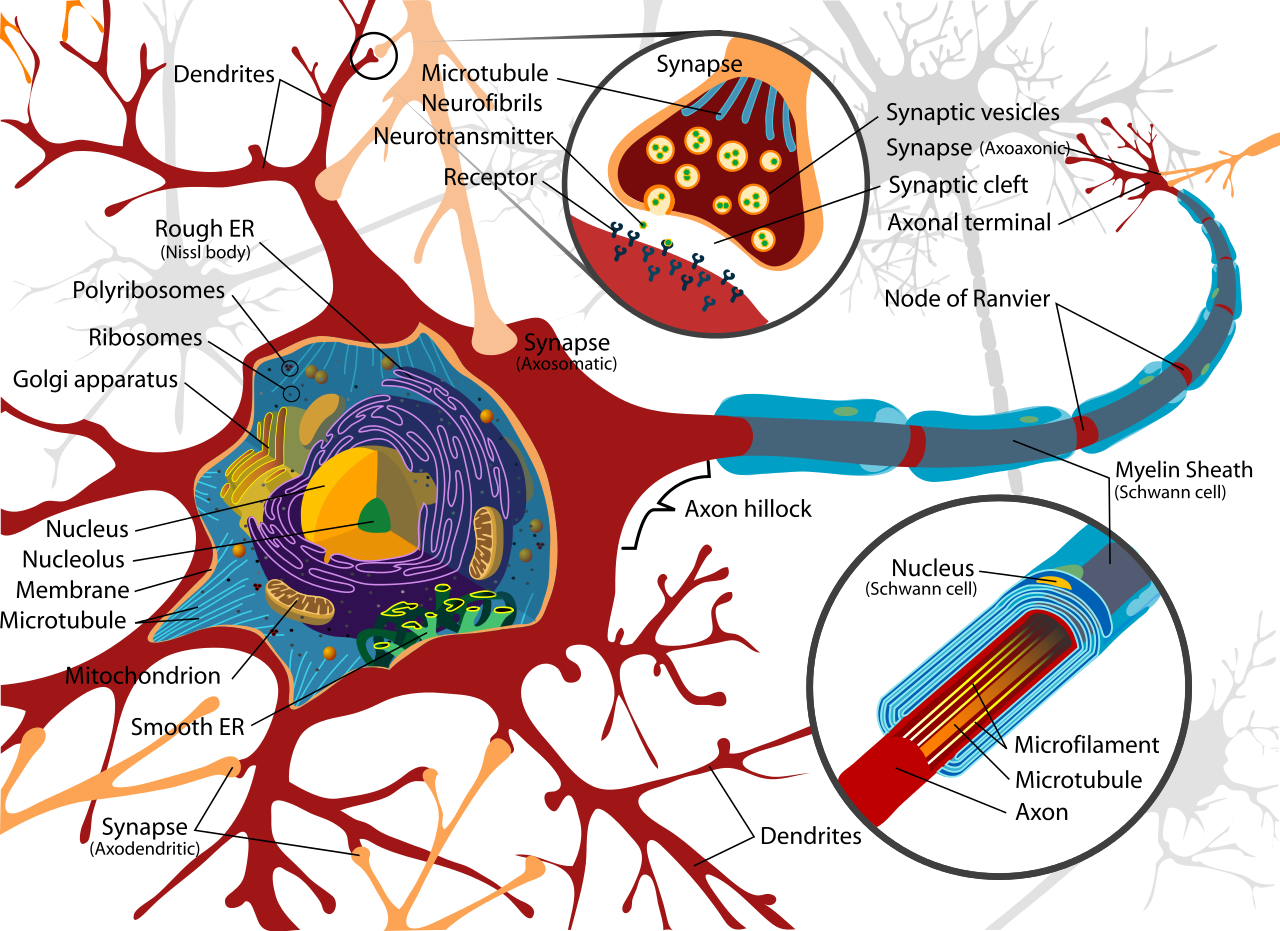
Neurons (also called brain cells or nerve cells) are the basic working units of the brain that generate the electrical activity. Large assemblies of neurons in turn behave as electrical generators responsible for the brain waves measured on the scalp. Neurons need both electrical and chemical stimulation in order to operate. Neurons function in both the initiation and the conduction of electrical impulses in our nervous system. In order to produce an electrical impulse, neurons must be triggered by a "stimulus," which can be anything inside or outside the body that evokes a physical or psychological response.
When triggered, the electrical impulse travels along the neuron’s outgoing branch, called the axon. The axon is surrounded by a myelin sheath (a fatty covering) that acts as an electrical insulator. The myelin sheath also assists the speed of the travelling electrical impulse down the axon to the point at which it meets the next neuron at a synapse.
The incoming branches are called dendrites. The space where the axon of one nerve cell connects with the dendrite of the next nerve cell is called the synapse, or synaptic gap on account of the 1/1,000,000 inch gap at this point.
Neurotransmitter Chemicals
Nerve signals jump the synaptic gap with the help of specialised chemicals called neurotransmitters that are released from the tips of the dendrite. These neurotransmitters carry messages from neuron to neuron to neuron. Depending on the stimulus, these neurotransmitter chemicals will act either to excite or inhibit a response depending upon which chemical (e.g., norepinephrine, dopamine, serotonin, acetylcholine) are released into the synaptic gap.
Drug Effects
There may be several different neurotransmitters at a synapse simultaneously, causing a communication "debate" resulting in an electrochemical resolution, a message causing either the firing or in the inhibition of firing or the neuron. The chemical messages exchanged at the synapses are susceptible to such things as fatigue, Essential Fatty Acid and micronutrient deficits, oxygen deprivation, toxic chemicals, and drugs. Psychoactive drugs are pharmaceutical agents that work by either imitating or interfering with the chemistry of the neurotransmitters, thereby influencing the message received at the nerve synapse. Hence the firing of neurons reflects the chemical activity occurring at the synapses.
Brain Mapping for ADHD
Quantitative EEG topography, sometimes referred to as "Topometric Brain Mapping" measures the electrical patterns present on the surface of the scalp. Accessed and analysed through digital technology, these measurements primarily reflect cortical electrical activity or "brainwaves." Some brainwaves occur at faster frequencies, or wave speeds; some are quite slow. The classic names of these EEG bands are delta, theta, alpha, SMR and beta and are identified according to their frequency, which is measured in terms of repetitions (or "cycles") per second ("cps") or "Hertz" (Hz). There are some variations in opinion as to the best way to group brain waves into clinical bands, but generally, it is agreed that, from slow to fast, brain waves should be grouped as follows:
- Delta brain waves (1-3 Hz) are the slowest, highest amplitude brainwaves, and are present primarily during sleep or when in an empathetic state. Excess delta activity in the awake state is usually indicative of dysfunction.
- Theta waves (4-8 Hz) are present when daydreaming or fantasising. At the same time, creativity and intuition are also associated with theta waves. This contrast occurs because theta waves occur at two levels: The lower range of theta (4-5 Hz) basically represents the twilight zone between waking and sleep. It is a profoundly calm, serene, floaty, drifty state. In this range, conscious intellectual activity is not occurring. It is also the range of frequencies produced in excess by children and adults with ADHD.
By contrast the higher range of theta (6-8 Hz), when present at midline frontal sites is associated with a state of highly inwardly focused attention. This is where the mind goes when we are engaging in complex, inwardly focused problem solving, such as mental arithmetic. This is also the level people enter when they go into in a deep hypnotic or meditative state. Persons experienced in self-hypnosis and highly hypnotizable persons (as well as very proficient meditators) produce more 6-8Hz theta brainwaves in both a waking state and in hypnosis.
- Alpha waves (8-11 Hz) are slower and larger. They are associated with a state of relaxation and basically represent the brain shifting into idling gear, relaxed and disengaged, waiting to respond when needed. If one merely closes his or her eyes and begins picturing something peaceful, in less than half a minute there will be an increase in alpha brainwaves. Alpha is present typically when one feels at ease and calm or in a position to change one's mind efficiently and effectively in order to accomplish a task.
- Sensory Motor Rhythm (12-15 Hz) measured over the sensorimotor cortex are brain waves associated with mental alertness and readiness for action, combined with behavioural stillness.
- Beta waves (16 Hz and above) are small, faster brainwaves associated with a state of mental or intellectual activity and outwardly focused concentration. Beta waves are present when one is thinking, problem solving, processing information, or anxious.
Having made these differentiations among the various brain wave bands, it must also be pointed out that at any one time everyone has a mix of all those brainwave frequencies present in different parts of the brain. However research has shown that:
- In the awake state, delta brainwaves also occur when areas of the brain go "off line" to take up nutrients.
- If one is becoming drowsy, there are more delta and slow theta brainwaves present.
- If someone is inattentive to external events and daydreaming (internalising), there is more low frequency 4-7 Hz theta present.
- If individuals are exceptionally anxious and tense, excess high frequency beta activity is present.
- Persons with ADHD, learning disabilities, and head injuries tend to have excess slow waves (usually delta, slow theta, and sometimes alpha). When excess slow wave activity is present in the frontal lobe of the brain, it is difficult to control attention, behaviour, and emotions. Such persons may have serious problems with concentration, memory, controlling impulses and moods, or with hyperactivity. They can’t focus well and exhibit diminished intellectual efficiency.
While all types of brain waves are always present regardless of the state of mind, the dominant frequency generally describes an individual’s state of consciousness. No frequency is "better" or "worse" than any other. In fact, each is essential to healthy mental functioning. Problems arise when humans have the improper mix of frequencies for dealing with the task at hand.
Brain Wave Analysis or Topographic Brain Mapping
Generally speaking, QEEG is an assessment tool used to aid in identifying mental health conditions by means of statistical evaluations of the EEG. The QEEG is useful to the clinician as an adjunct to traditional clinical assessment, as it provides a sensitive and specific method to detect subtle variations in the activity of the brain. Subtle brain wave variations might otherwise go unnoticed by the clinician, even with a traditional, visually inspected EEG. But the computer-based QEEG may provide evidence of an underlying dysfunction that needs to be recognised, evaluated and treated. QEEG is the only widely available technology that can be used for this purpose today.
In the past QEEG reports have not been readily understandable to the average clinician, who does not have extensive training in QEEG physiological correlates or clinical neuroscience. Up until now, these factors have been barriers to the broader acceptance of QEEG as a clinical science. Nowadays however, the use of a scientifically validated QEEG database (John and Prichep, 1988) whose establishment and validation has been extensively peer reviewed in the literature, provides well normed data sets, standardisation of processes and clarification of information reported. This makes the resulting reports and interpretations are more readily understood and more useable by healthcare practitioners.
QEEG Differentiates Between ADHD Brain vs Normal Brain
Research has found that QEEG has a high level of reliability that is equal or superior to routinely used clinical tests such as mammograms, cervical screenings, blood tests, MRI and CAT scans. A comprehensive literature review (Hughes & John, 1999) in the Journal of Neuropsychiatry and Clinical Neurosciences reported,
"Of all the imaging modalities, the greatest body of replicated evidence regarding pathophysiological concomitants of psychiatric and developmental disorders has been provided by EEG and QEEG studies."
QEEG measures the minute electrical activity of a person's brain and then, using proprietary software, compares that unique pattern to known databases of normal brain vs ADHD brain patterns. This type of computer-driven statistical analysis is particularly useful in evaluating difficult and borderline cases.
The Patient’s Data Collection Experience
The data collection procedure begins with a simple, non-invasive procedure in which a clinician or qualified technician captures a sample of the raw electrical activity of the patient’s brain, using an "electrode cap" with 10/20 electrode placement (fig. 1).
Sensors in the cap are electrically connected to the scalp by means of a gel that can be simply washed off with water after the data recording. The cap is connected to specialised medical equipment that amplifies the microscopic electrical signals that the patient’s brain produces and sends those signals to a computer.
A syringe with a blunt needle is used to squirt conductive gel into the sensors.
Fig 1. Electrocap used in data collection procedure
Fig 2. Topometric QEEG maps expressed in Z scores (standard deviations from the norm).
QEEG maps expressed as "Z scores" (standard deviations from the norm).
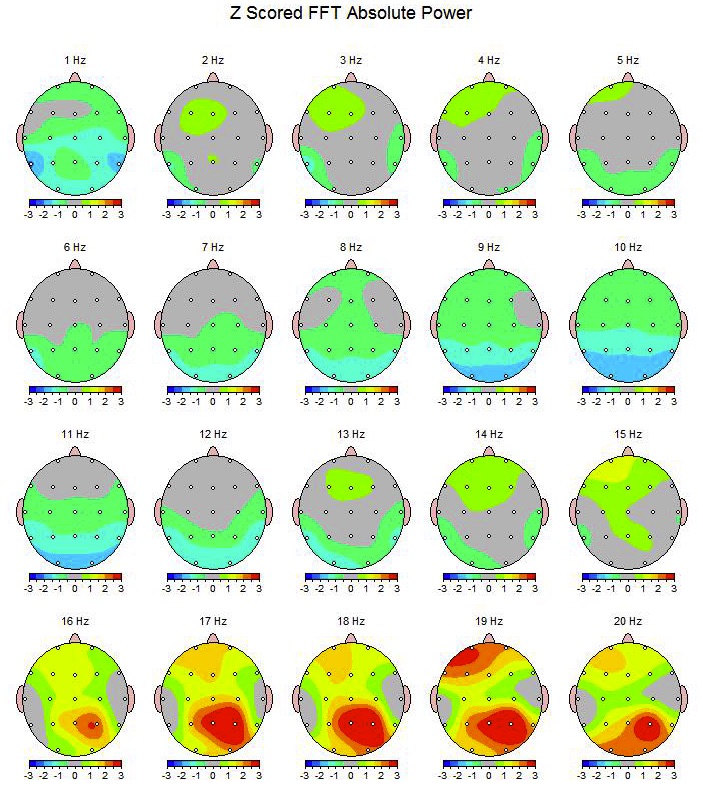
The colour grey and one colour bands on either side of grey on the scale are considered to be within the normal range. The hotter colours indicate excesses and the colder colours indicate deficits. There are hundreds of studies using QEEG to investigate patterns of brain activity and their associated behaviours and psychiatric presentations. Knowledge of these patterns helps us determine what brain electrical patterns are associated with ADHD, Learning Difficulties, Depression and Anxiety enabling us to formulate more targeted treatment strategies
There are hundreds of studies using QEEG to investigate patterns of brain activity and their associated behaviours and psychiatric presentations. Knowledge of these patterns helps us determine what brain electrical patterns are associated with ADHD and Learning Difficulties, enabling us to formulate more targeted treatment strategies
Report
A key feature of the report is the probability statement, a highly distilled reduction of an extremely complex process involving thousands of data sets. The report also highlights those characteristics found to be the most significant statistical contributors to the discriminant findings.
Further, the report includes full colour topographic maps and tables (of data that can be used for more detailed analysis, should the referring clinician choose to forward the patient data and report to a specialist for additional interpretation.
Ease and Safety
The only electricity involved in the cap comes from electrical activity produced by the patients own brain. No electricity flows towards the patient. In fact, there is no possibility of the patient receiving electrical currents from the connections, as the patient and the cap are specifically isolated from all of the other equipment. Once the electrode cap has been put on the patient will need to sit quietly for a few minutes with eyes closed while the computer collects a sample of brain wave activity. During data collection, the patient is asked to minimise movements of the head, blinking, and clenching of the jaw muscles. The entire recording process usually takes less than an hour.
Standardised data analysis insures reliability and validity
Once a sample of the electrical activity data of the patient’s brain has been collected, the proprietary software of the acquisition device performs a computerised transformation of the raw, analog brain waves into digital form, which can be analysed by the computer. The first phase of analysis is designed to identify, characterise and highlight brainwave activity on the basis of its prominent features. Next, the analysis uses computerised statistical procedures to make over a thousand statistical analyses to compare patient EEG patterns with those of a scientific normative database that have been developed over the past twenty years in major research laboratories and hospitals.
This procedure provides a sensitive and specific method to detect subtle variations in the activity of the brain and quantifies the likelihood that a particular patients profile is consistent with one or more of the clinical groups in the original database studies.
The results of a brain wave analysis allows us to determine, in a highly scientific, objective manner whether, and how, the patients brainwave patterns are significantly different from what is considered normal for the patient's age group.
Discriminant Equations
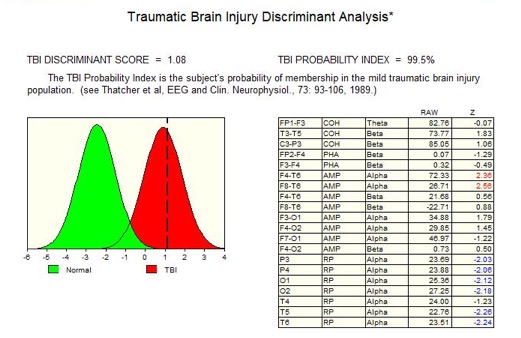
Next, the individual patient QEEG data are compared to a large database of patients with known disorders. The patients QEEG data are tested against "discriminant equations," a set of multi variant, derived measures that facilitate a "pattern recognition" process.
Using the discriminant equations, it is possible, statistically, to compare the EEG profile of a patient with the profiles found in a variety of clinical conditions. The discriminant functions quantify the likelihood (i.e., probability) that a particular patients profile is consistent with one or more of the clinical groups in the original database studies. The likelihood of group membership is then presented as a statistical probability statement.
The diagram on the left is of a Discriminant function results for a mild head injury patient indicating that there was a high degree of probability that the patients EEG still reflects a head injury.
FDA Regulation
The clinic uses the 32 channel Deymed data acquisition system approved for medical and research applications. It is regulated by the FDA (US Federal Drug Administration) and Neuroguide, a proprietary QEEG software product also FDA approved for the adjunct discriminant analysis of mental health disorders.
Diagnostic Use of the QEEG for ADHD
Some practitioners associate the science of EEG quantification exclusively with Neurotherapy. This is far from the truth. Aside from its use as a roadmap to guide EEG operant training, the quantification of brain wave activity is a powerful diagnostic aid that transcends treatment modality.
At this time in the history of psychiatric disorders, a specific strength of QEEG that is particularly relevant, is its use in guiding decisions about the use of pharmaceuticals. The past decade has witnessed the launch of new generations of psychoactive drugs for use with less severe mental health problems. These drugs have been prescribed with what some have claimed to be increasing casualness, raising concerns in the literature about the diagnostic measures on which these prescriptions have been based.
There is a pressing need for a tool, such as the QEEG report, that offers a powerful adjunct leading to more accurate and more scientifically measurable mental health information based on QEEG analysis. We have the opportunity of obtaining QEEG reports that may help answer several implicit questions relating to the underlying neurophysiology:
- Which patients should receive drug treatment?
- Which patients should not?
- What class of drugs might most benefit the patient?
- What changes occur in the patient as the result of taking the medication?
- Whether global abnormalities may relate to intestinal dysbiosis and cortical toxicity.
- When the patient’s QEEG is consistent with HPA axis dysregulation. The QEEG in conjunction with patient history can provide valuable clues as to whether the aetiology is due to chronic toxicity from intestinal dysbiosis or food allergies or from trauma-related HPA hyperactivation.
- Such information guides further investigations and suggests which neurotransmitter system, serotonergic as opposed to dopaminergic/noradrenergic, should be targeted with either medication and/or nutrient supplementation.
- What changes have taken place as a result of nutrient supplementation.
- Whether focal abnormalities are best redressed with Neurothearapy and or Dietary changes and Nutrient supplementation
Through the use of normative and discriminant databases, the quantification of EEG should prove to be of significant value in helping clinicians determine the underlying neurophysiology of the mental health problems of their patients and guide treatment more effectively.
Bibliography
Amen, Daniel G. Windows into the A.D.D Mind, Understanding and Treating Attention Deficit Disorders in the Everyday Lives of Children, Adolescents, and Adults MindWorks Press, 1997.
Benson, D. Frank. (1991). The role of frontal dysfunction in Attention Deficit Hyperactivity Disorder.Journal of Child Neurology, 6 (suppl.), S9-212.
Chabot, R. J., Merkin, Henry, Wood, L.M., Davenport, T.L., Serfontein, Gordon, Sensitivity and Specificity of QEEG in Children with Attention Deficit or Specific Developmental Learning Disorders,Clinical Electroencephalography, 1995; Vol. 27 (1) 26-33
Colby, C.L. (1991). The Neuroanatomy and neurophysiology of attention. Journal of Child Neurology, 6 (suppl.), S88-S116.
Dawson, R.E., Webster, J.W., & Gurdjian, E.S., (1951) Serial electroencephalography in acute head injuries. Journal of Neurosurgery, 8, 613.Duffy, F.H., Hughes, J.R., Miranda, F., Bernad, P., Cook, P., Status of Quantified EEG (QEEG) in Clinical Practice, Clinical Electroencephalography, 1994, 25: 6-22
Gunewald-Zuberbier, E., Grunewald, G., Raske, A. (1975) Hyperactive behavior and EEG arousal reactions in childhood. EEG and Clinical Neurophysiology, 38, 149-159.
Dawson, R.E., Webster, J.W., & Gurdjian, E.S., (1951) Serial electroencephalography in acute head injuries. Journal of Neurosurgery, 8, 613.
Hughes, J.R., & John, E.R., Conventional and Quantitative Electroencephalography in Psychiatry,The Journal of Neuropsychiatry and Clinical Neurosciences, 1999, 11: 190-208
Jasper, H.H., Solomon, P., & Bradley, C. (1938). Electroencephalographic analysis of behavior problems in children. American Journal of Psychiatry. 95, 641-658.
John, E.R., Prichep, L.S., Firdman, J., & Easton, P. (1988). Neurometrics: Computer-assisted differential diagnosis of brain dysfuncitons. Science, 239, 162-169.
Klinkerfuss, G.H., Lange, P.H., Weinberg, W.A., & O'Leary, J.L. (1965). Electroencephalographic abnormalities of children with hyper-kinetic behavior. Neurology, 15, 883-891.
Kramer, P. D. (1993) Listening to Prozac Penguin, New York
Lubar, J.F., Bianchini, K.J., Calhoun, W.H., Lambert, E.W., Brody, Z.H., & Shabsin, H.S. (1985).Spectral analyses of EEG differences between children with and without learning disabilities. Journal of Learning Disabilities, 18, 403-408.
Matousek, M., Rasmussen, P., & Gillberg, C. (1984). EEG frequency analysis in children with so-called minimal brain dysfunction and related disorders. Advances in Biological Psychiatry, 15, 102-108.
Mechelse, K., van Gemund, J.J., Nije, J.D., Burg, L., & Laurs, J., (1975) Visual and quantitative analysis of EEGs of normal school aged children and school children with specific reading disability.Electroencephalography and Clinical Neurophysiology, 39, 106-107.
Niedermeyer, E. & Naidu, S.B. (1997). Attention-Deficit Hyperactivity Disorder (ADHD) and Frontal-Motor Cortex Disconnection. Clinical Electroencephalography, 28(3), 130-136.
Satterfield, D.H., Lesser, L.I., Sand, R.E., & Cantwell, D.P. (1973) EEG aspects of the diagnosis and treatment of minimal brain dysfunctions. Annals of New York Academy of Sciences, 205, 273-282.
Thatcher, Robert W., Walker RA, Gerson I, Geisler F. EEG Discriminant Analysis of Mild Head Trauma, Electroencephalography and Clinical Neurophysiology, 1989, 73: 94-106
Thatcher, Robert W., QEEG and Traumatic Brain Injury: Present and Future, Brain Injury Source, 3: 23-31 1999
Thatcher, Robert W., EEG Operant Conditioning (Biofeedback) and Traumatic Brain Injury, Clinical Electroencephalography, 2000; Vol. 31 (1) 38-44.
Winkler, A.W., Dixon, J.F., & Parker, J.B. (1970). Brain function in problem children and controls: Psychometric, neurological and electroencephalographic comparisons. American Journal of Psychiatry, 127, 634-645.
Zametkin, A.J., Rappaport, J.L., (1987) Noradrenergic hypothesis of attention deficit disorder with hyperactivity: A critical review. In: Metsler, H.V., (ed.) Psychopharmacology: The Third Generation of Progress, Raven Press, New York, 837-842.
Zametkin, A.J., Nordahl, T.F., et al., (1990) Cerebral glucose metabolism in adults with hyperactivity of childhood onset. New England Journal of Medicine, 323, 20, 1361-1363.